Symmetrical Triangle: How it works
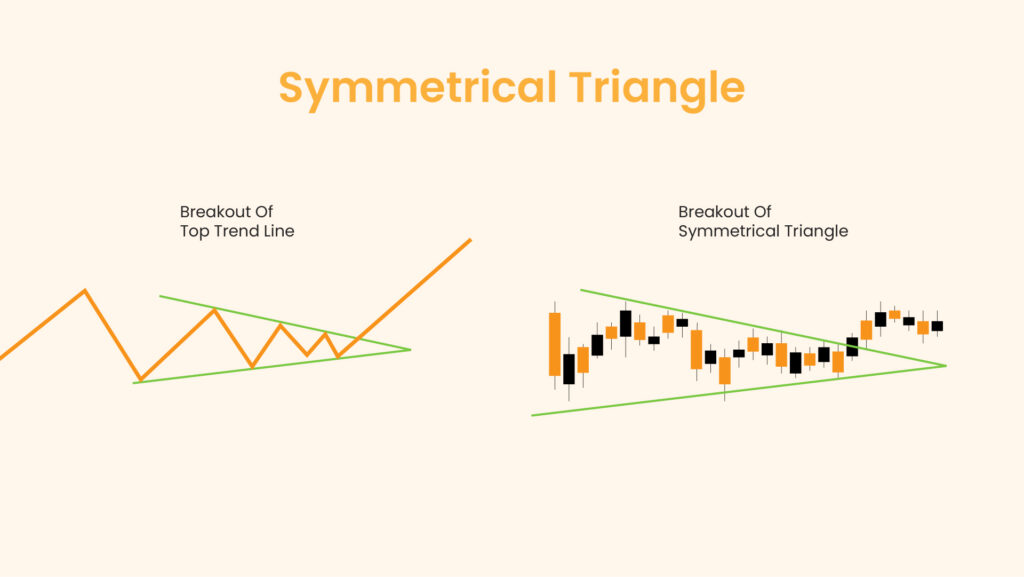
A Symmetrical Triangle is a chart pattern that is common in technical analysis. It is a chart formation that represents the pause of a trend, hence a consolidation phase before the trend resumes. The pattern is characterized by two converging trendlines connecting a series of sequential peaks and troughs. These trendlines converge to form a triangle that slopes towards a point, known as the apex.
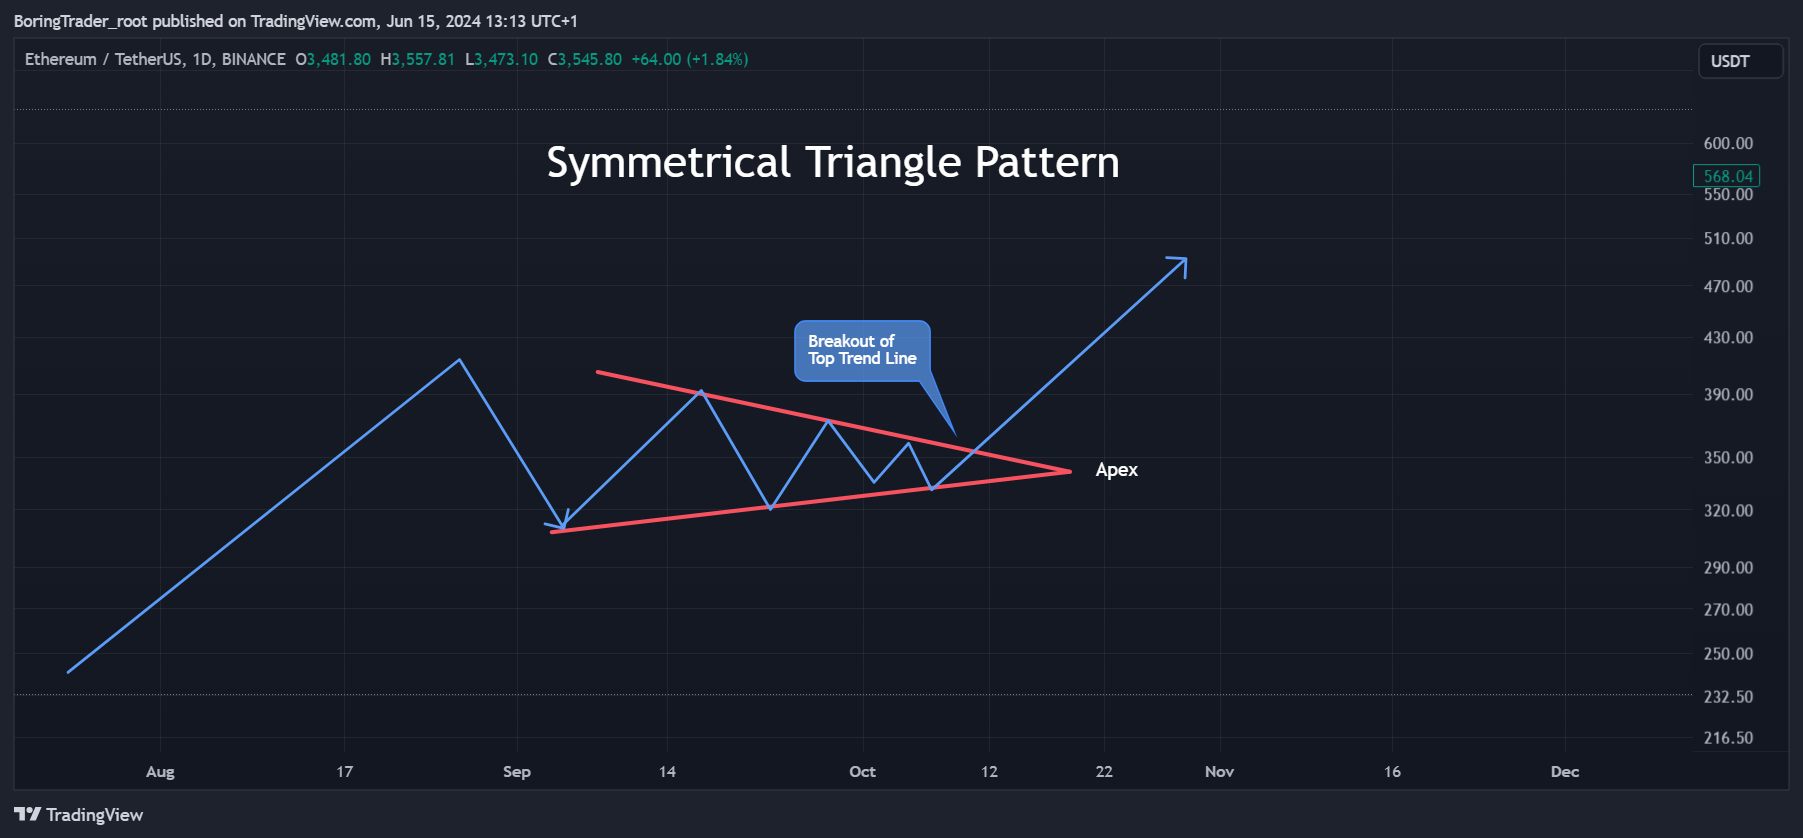
Symmetrical Triangles occur when the forces of supply and demand are in equilibrium, leading to a narrowing price range. As the pattern develops, it suggests that neither the buyers nor the sellers are in control. The eventual breakout from this pattern indicates the direction of the prevailing trend, often leading to a significant price movement.
Definition of Symmetrical Triangle
A Symmetrical Triangle is defined by two converging trendlines, where one connects a series of lower highs and the other connects a series of higher lows. The resulting shape is a symmetrical triangle. Referencing the daily time frame, the pattern typically forms over a period of one to three months and represents a period of consolidation before the price breaks out in the direction of the previous trend.
Identifying the Symmetrical Triangle
To identify a Symmetrical Triangle, follow these steps:
- Trendlines: Draw two converging trendlines connecting at least two highs and two lows.
- Convergence: Ensure that the trendlines converge towards an apex, indicating narrowing price ranges.
- Volume: Look for a decline in volume as the pattern progresses, signifying consolidation.
- Breakout: Watch for a breakout from the triangle. The direction of the breakout usually aligns with the preceding trend.
Trading the Symmetrical Triangle
Trading a Symmetrical Triangle involves anticipating the breakout direction and acting accordingly. The first step is to enter a trade when the price breaks out of the triangle, either above the upper trendline or below the lower trendline.
Confirmation of the breakout is essential and should be validated with increased volume to ensure its legitimacy. To manage risk, a stop-loss order should be placed just outside the opposite side of the triangle. For the profit target, measure the height of the triangle at its widest point and project this distance from the breakout point.
What is a Symmetrical Triangle Pattern?
A Symmetrical Triangle Pattern is a continuation pattern that indicates a period of consolidation before the prevailing trend resumes. It is marked by converging trendlines connecting lower highs and higher lows, forming a symmetrical shape. The breakout direction is typically in line with the prior trend, providing traders with a signal for potential price movement.
Key Notes
- Continuation Pattern: Symmetrical Triangles are continuation patterns indicating trend consolidation.
- Converging Trendlines: The pattern is formed by two converging trendlines connecting lower highs and higher lows.
- Volume Decline: Volume typically decreases as the pattern develops, signifying consolidation.
- Breakout Direction: The breakout direction usually aligns with the preceding trend.
- Apex: The point where the trendlines converge is known as the apex.
Symmetrical Triangle Explained
The Symmetrical Triangle pattern reflects a balance of power between buyers and sellers, resulting in a narrowing price range. The converging trendlines signify this equilibrium, with neither side able to push the price decisively. As the pattern develops, the price oscillates between the two trendlines, creating a series of lower highs and higher lows.
When the price finally breaks out from the pattern, it signals that one side has gained control. This breakout often leads to a significant price movement, with the direction of the breakout usually following the prevailing trend. The volume should increase during the breakout, confirming the pattern’s validity.
Identifying Inverse Symmetrical Triangle Patterns
To identify a Symmetrical Triangle pattern, begin by ensuring there is a prior trend before the formation of the triangle, as it is a continuation pattern. Next, draw two converging trendlines that connect at least two peaks and two troughs. These trendlines should converge towards a point known as the apex. As the pattern develops, look for a decline in volume. Finally, wait for the price to break out of the triangle and confirm the breakout with increased volume.
Real Symmetrical Triangle Examples
Example 1: Trading the Symmetrical Triangle Pattern (ETHUSD)
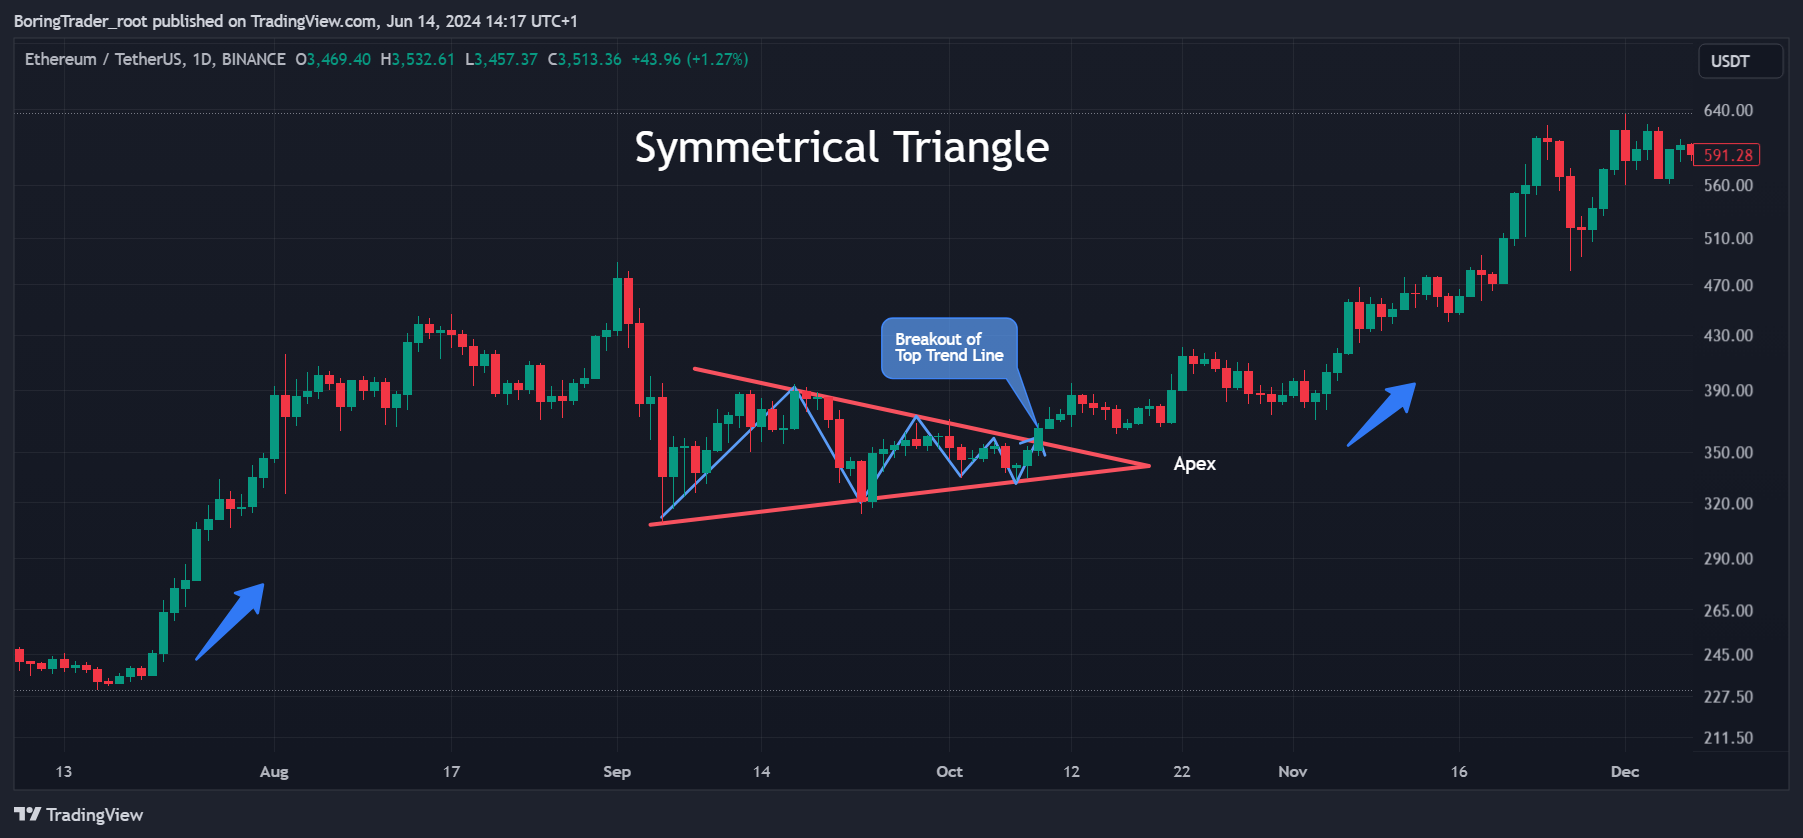
The Symmetrical Triangle pattern is a prominent continuation pattern often emerging during market consolidation phases. In this analysis, we explore how a professional trader would identify, trade, and establish take profit and stop-loss levels for the Symmetrical Triangle pattern, using the ETHUSD crypto pair as a practical example.
Identifying the Symmetrical Triangle Pattern
To accurately identify a Symmetrical Triangle pattern, traders need to look for specific characteristics. The pattern is marked by converging trendlines, with one trendline connecting lower highs and the other connecting higher lows, forming a triangular shape. Both trendlines should ideally exhibit similar slopes, converging towards an apex. Additionally, a typical reduction in volume as the pattern forms signals market consolidation.
In the case of the ETHUSD crypto pair, the upper trendline connects the highs in early and late September, while the lower trendline connects the lows in mid-September and early October, converging towards an apex in mid-October.
Trade Entry
Experienced traders await a breakout to confirm the pattern before entering a trade, as the breakout can occur in either direction, with the prevailing trend usually resuming. A bullish breakout occurs when the price breaks above the upper trendline accompanied by increased volume, indicating a bullish continuation.
Conversely, a break below the lower trendline with increased volume signals a bearish continuation. In the attached chart, the breakout transpires above the upper trendline in early October, corroborated by a noticeable surge in volume. Traders typically enter the trade at the close of the candle that breaks out of the triangle.
Take Profit Target
To determine the take profit target, traders measure the height of the triangle at its widest point—the vertical distance between the initial high and low of the pattern. This distance is then added to the breakout point for a bullish breakout or subtracted from the breakout point for a bearish breakout. For example, if the height of the triangle is $100 (from $300 to $400), and the breakout point is $365, the take profit target would be $465 for a bullish breakout. In the chart, the take profit target is effectively met as the price ascends to approximately $465, significantly surpassing the target.
Stop-Loss Placement
Professional traders place a stop-loss to manage risk if the trade does not perform as anticipated. For a bullish breakout, the stop-loss is set below the low of the breakout candle, while for a bearish breakout, the stop-loss is placed above the high of the breakout candle. In the chart, the stop-loss for the bullish breakout is positioned below the breakout candle at approximately $340.
Key Notes of Real-Life Example Trading ETHUSD
In this practical example, the pattern identification begins with recognizing the symmetrical triangle with converging trendlines and decreasing volume. Traders then monitor for a breakout accompanied by increased volume, entering the trade at the close of the breakout candle (e.g., $360 for a bullish breakout). They set the take profit target based on the measured height of the triangle (e.g., $520 for a bullish breakout) and place the stop-loss below the breakout candle (e.g., $340 for a bullish breakout).
Example 2: Trading the Symmetrical Triangle Pattern (LINKUSD)
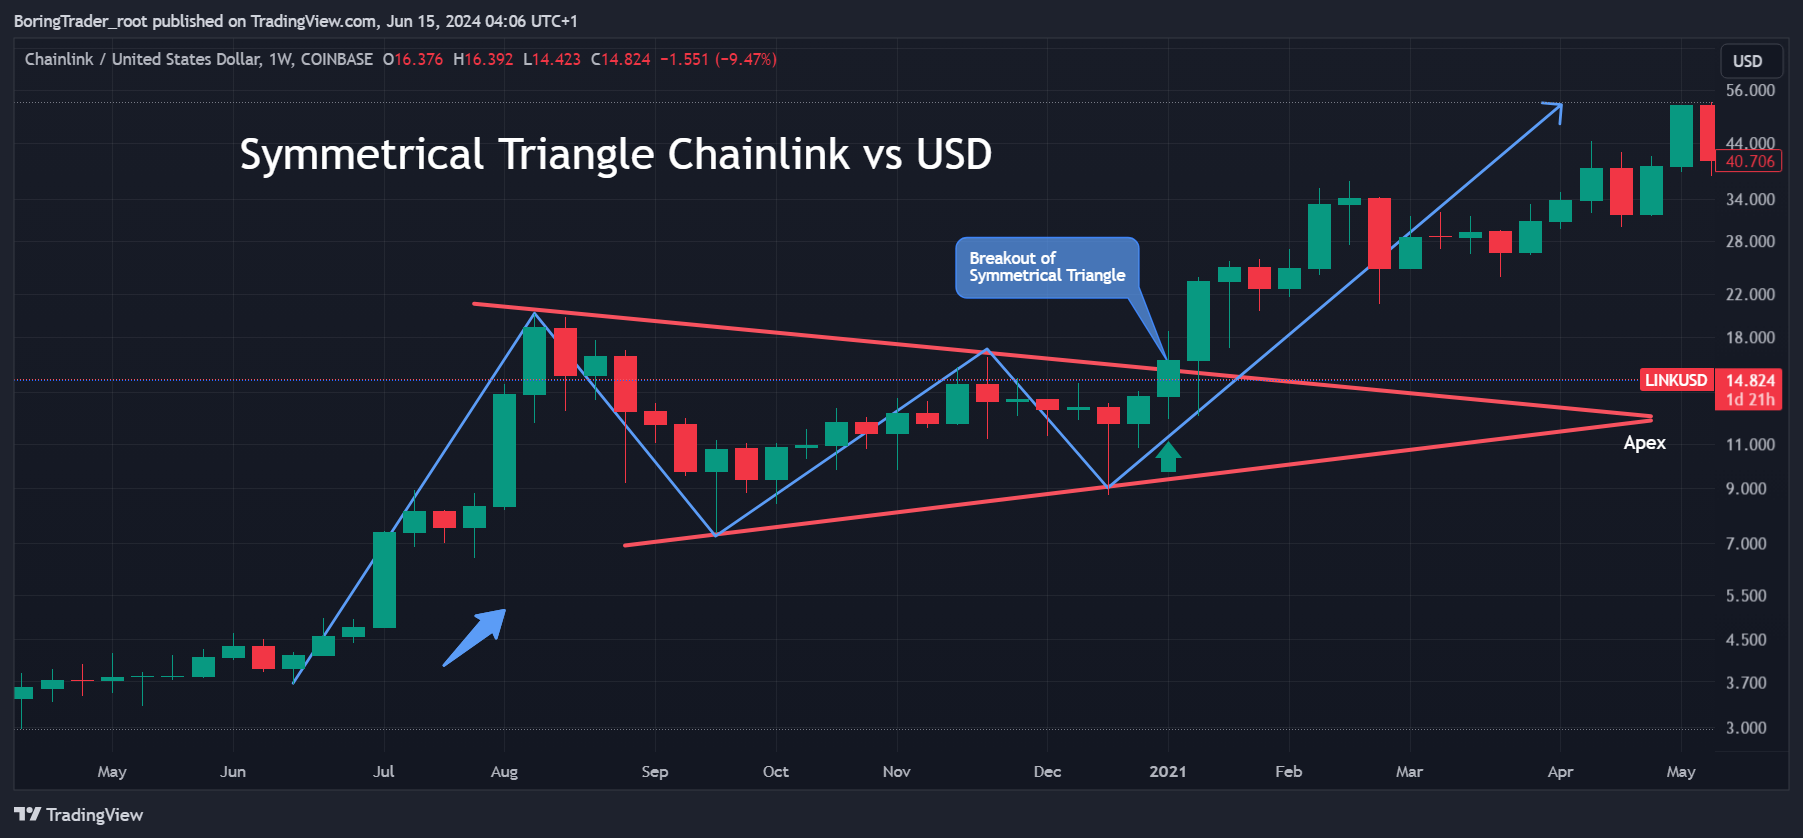
The Symmetrical Triangle pattern, known for its role as a continuation pattern, frequently emerges during trend consolidation phases. This analysis focuses on how professional traders identify, trade, and set take profit and stop-loss levels for the Symmetrical Triangle pattern using the LINKUSD crypto pair as an example.
Identifying the Symmetrical Triangle Pattern
To identify a Symmetrical Triangle pattern, traders look for converging trendlines, where one trendline connects lower highs and the other connects higher lows, forming a triangular shape. Both trendlines should exhibit similar slopes, converging towards an apex, and volume typically decreases as the pattern forms, signaling consolidation. In the case of LINKUSD, the upper trendline connects the highs in August and November, while the lower trendline connects the lows in September and December, converging towards an apex in early January.
Trade Entry
Professional traders wait for a breakout to confirm the pattern before entering a trade, with the breakout potentially occurring in either direction. A bullish breakout occurs when the price breaks above the upper trendline with increased volume, indicating a bullish continuation. Conversely, a bearish breakout occurs when the price breaks below the lower trendline with increased volume, signaling a bearish continuation. In the attached chart, the breakout occurs above the upper trendline in late December, confirmed by a significant volume increase. Traders enter the trade at the close of the candle that breaks out of the triangle.
Take Profit Target
To set the take profit target, traders measure the height of the triangle at its widest point, which is the vertical distance between the initial high and low of the pattern. This distance is then added to the breakout point for a bullish breakout or subtracted from the breakout point for a bearish breakout. For example, if the height of the triangle is $20 (from $9 to $29), and the breakout point is $16, the take profit target would be $36 for a bullish breakout. In the chart, the take profit target is reached as the price climbs to around $44, well above the target.
Stop-Loss Placement
Professional traders place a stop-loss to manage risk if the trade does not perform as anticipated. For a bullish breakout, the stop-loss is placed below the low of the breakout candle, while for a bearish breakout, the stop-loss is placed above the high of the breakout candle. In the attached chart, the stop-loss for the bullish breakout is positioned below the breakout candle at around $14.
Key Notes of Real-Life Example trading LINKUSD
In this practical example, the pattern identification begins with recognizing the symmetrical triangle with converging trendlines and decreasing volume. Traders then monitor for a breakout accompanied by increased volume, entering the trade at the close of the breakout candle (e.g., $16 for a bullish breakout). They set the take profit target based on the measured height of the triangle (e.g., $36 for a bullish breakout) and place the stop-loss below the breakout candle (e.g., $14 for a bullish breakout).
Traders can follow the steps from these examples to effectively leverage the Symmetrical Triangle pattern to make well-informed trading decisions, mitigate risks, and optimize potential returns.
How to Trade a Symmetrical Triangle Pattern
Trading a Symmetrical Triangle involves several key steps:
- Identify the Pattern: Look for converging trendlines connecting lower highs and higher lows in a prior trend.
- Wait for Breakout: Anticipate a breakout from the triangle, either above the upper trendline or below the lower trendline.
- Confirm Breakout: Ensure the breakout is accompanied by increased volume to confirm its validity.
- Enter Trade: Enter a trade in the direction of the breakout.
- Set Stop-Loss: Place a stop-loss order just outside the opposite side of the triangle to manage risk.
- Determine Profit Target: Measure the height of the triangle at its widest point and project this distance from the breakout point to set a profit target.
FAQ
Q: What does a Symmetrical Triangle pattern indicate?
A: It indicates a period of consolidation in a trend before the trend resumes.
Q: How reliable is the Symmetrical Triangle pattern?
A: It is considered a reliable continuation pattern when confirmed with increased volume during the breakout.
Q: Can the breakout direction vary?
A: Yes, the breakout direction can vary but typically aligns with the preceding trend.
Q: What is the significance of volume in this pattern?
A: A decline in volume during the pattern’s formation and an increase during the breakout confirm the pattern’s validity.
Q: Where should the stop-loss be placed?
A: The stop-loss should be placed just outside the opposite side of the triangle to limit potential losses.
In conclusion, mastering the Symmetrical Triangle pattern allows traders to recognize consolidation phases and predict potential breakouts, facilitating informed trading decisions and enhancing profit opportunities. With its distinct structure and dependable signals, this pattern is an invaluable asset for any technical analyst aiming to leverage trend continuations in the market.

