
Inverse Head and Shoulders – How it works
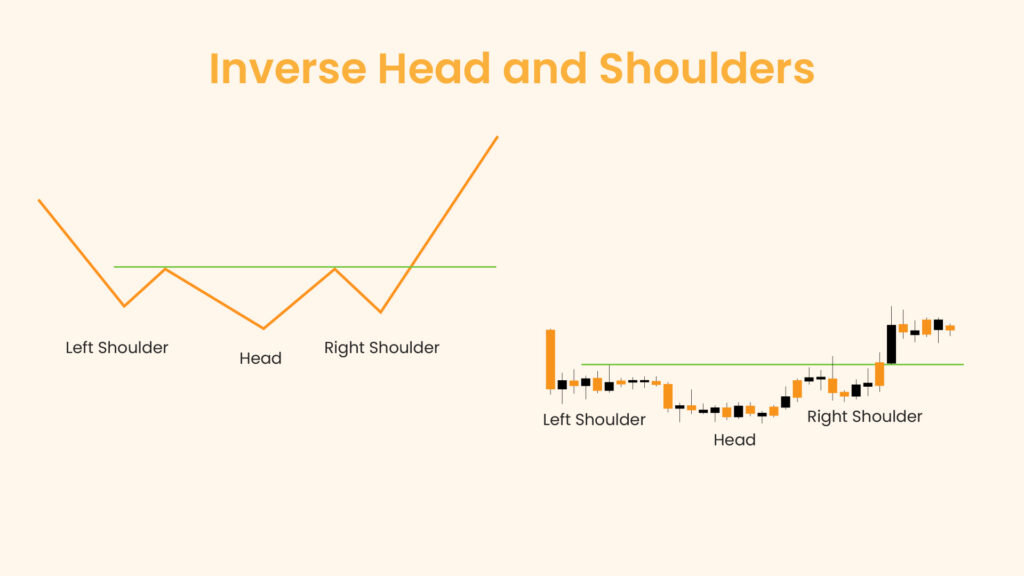
The Inverse Head and Shoulders pattern is a reversal chart pattern that signals the potential end of a downtrend and the beginning of an uptrend. It is a reliable price formation that traders use to identify potential buying opportunities in the market. This pattern forms when a security’s price makes three consecutive lows, with the middle low (the head) being the lowest and the two outside lows (the shoulders) being higher and roughly equal.
In essence, the Inverse Head and Shoulders pattern indicates a shift in market sentiment from bearish to bullish. When this pattern completes, it suggests that the downward pressure is easing and that the bulls are gaining strength, likely pushing the price higher.
Key Notes
Reversal Indicator: The inverse head and shoulders pattern is a bullish reversal pattern that indicates the end of a downtrend.
Volume Confirmation: A significant increase in volume during the breakout above the neckline confirms the pattern.
Reliable Pattern: The inverse head and shoulds pattern is considered one of the most reliable reversal patterns.
Neckline: The breakout above the neckline is the entry point for traders.
Stop-Loss: A stop-loss should be placed below the right shoulder to manage risk.
Definition of Inverse Head and Shoulders
The Inverse Head and Shoulders is a bullish reversal pattern that is commonly found at the end of a downtrend. It consists of three parts:
- Left Shoulder: The price declines to a new low and then rises to form a peak.
- Head: The price declines again, forming a lower low than the left shoulder before rising once more.
- Right Shoulder: The price declines for the third time but only to the level of the left shoulder before rising again.
The neckline is formed by connecting the peaks of the two rallies following the left shoulder and the head. When the price breaks above the neckline, it confirms the pattern and signals a potential upward move.
Identifying the Inverse Head and Shoulders
Identifying the Inverse Head and Shoulders pattern requires careful analysis of the price action. Here are the steps to identify this pattern:
- Look for a Downtrend: The pattern is only significant if it appears after a prolonged downtrend.
- Identify the Left Shoulder: Spot the first trough, followed by a peak.
- Identify the Head: Look for a lower trough, followed by another peak higher than the previous trough but not necessarily higher than the peak after the left shoulder.
- Identify the Right Shoulder: Find the third trough, which is higher than the head but similar in level to the left shoulder.
- Draw the Neckline: Connect the peaks after the left shoulder and the head. This line can be horizontal or sloped.
- Watch for a Breakout: The pattern is confirmed once the price breaks above the neckline on increased volume.
Trading the Inverse Head and Shoulders
Trading the Inverse Head and Shoulders pattern involves a few key steps to maximize the potential for profit and minimize risk:
- Entry Point: Enter a long position when the price breaks above the neckline. Ideally, this breakout should be accompanied by higher trading volume, which adds credibility to the pattern.
- Stop-Loss Placement: Place a stop-loss order below the lowest point of the right shoulder. This helps to protect against false breakouts and minimizes potential losses.
- Profit Target: Measure the distance from the head to the neckline. This distance is then projected upwards from the breakout point to set a potential profit target.
For example, if the distance from the head to the neckline is $10, and the breakout occurs at $50, the profit target would be $60 ($50 + $10).
What is an Inverse Head and Shoulders Pattern?
The Inverse Head and Shoulders pattern is a classic technical analysis chart pattern used to predict reversals in a downtrend. It signals that the previous bearish trend is likely to end and that a bullish trend may be beginning. This pattern is characterized by three consecutive troughs, with the middle trough (head) being the lowest and the two outside troughs (shoulders) being higher and approximately equal.
Inverse Head and Shoulders Explained
The Inverse Head and Shoulders pattern represents a shift in market dynamics. Initially, sellers dominate, pushing prices lower. The left shoulder forms when buyers attempt a rally but fail to sustain it, leading to another sell-off that creates the head. At this point, the selling pressure starts to wane, and buyers step in, leading to a higher low (right shoulder) as the selling attempts become less effective. The breakout above the neckline signifies that buyers have gained control, and the down trend is likely to reverse.
The Definition Identifying Inverse Head and Shoulders Patterns
To define and identify an Inverse Head and Shoulders pattern, follow these steps:
- Downtrend: Confirm the presence of a prior downtrend.
- Left Shoulder: Identify the first trough and subsequent peak.
- Head: Look for a lower trough followed by another peak.
- Right Shoulder: Spot the third trough, which is higher than the head but similar to the left shoulder.
- Neckline: Draw a line connecting the peaks after the left shoulder and the head.
- Breakout: Wait for the price to break above the neckline on increased volume.
Real Inverse Head and Shoulders Examples
To illustrate the Inverse Head and Shoulders pattern, let’s look at some real-world examples.
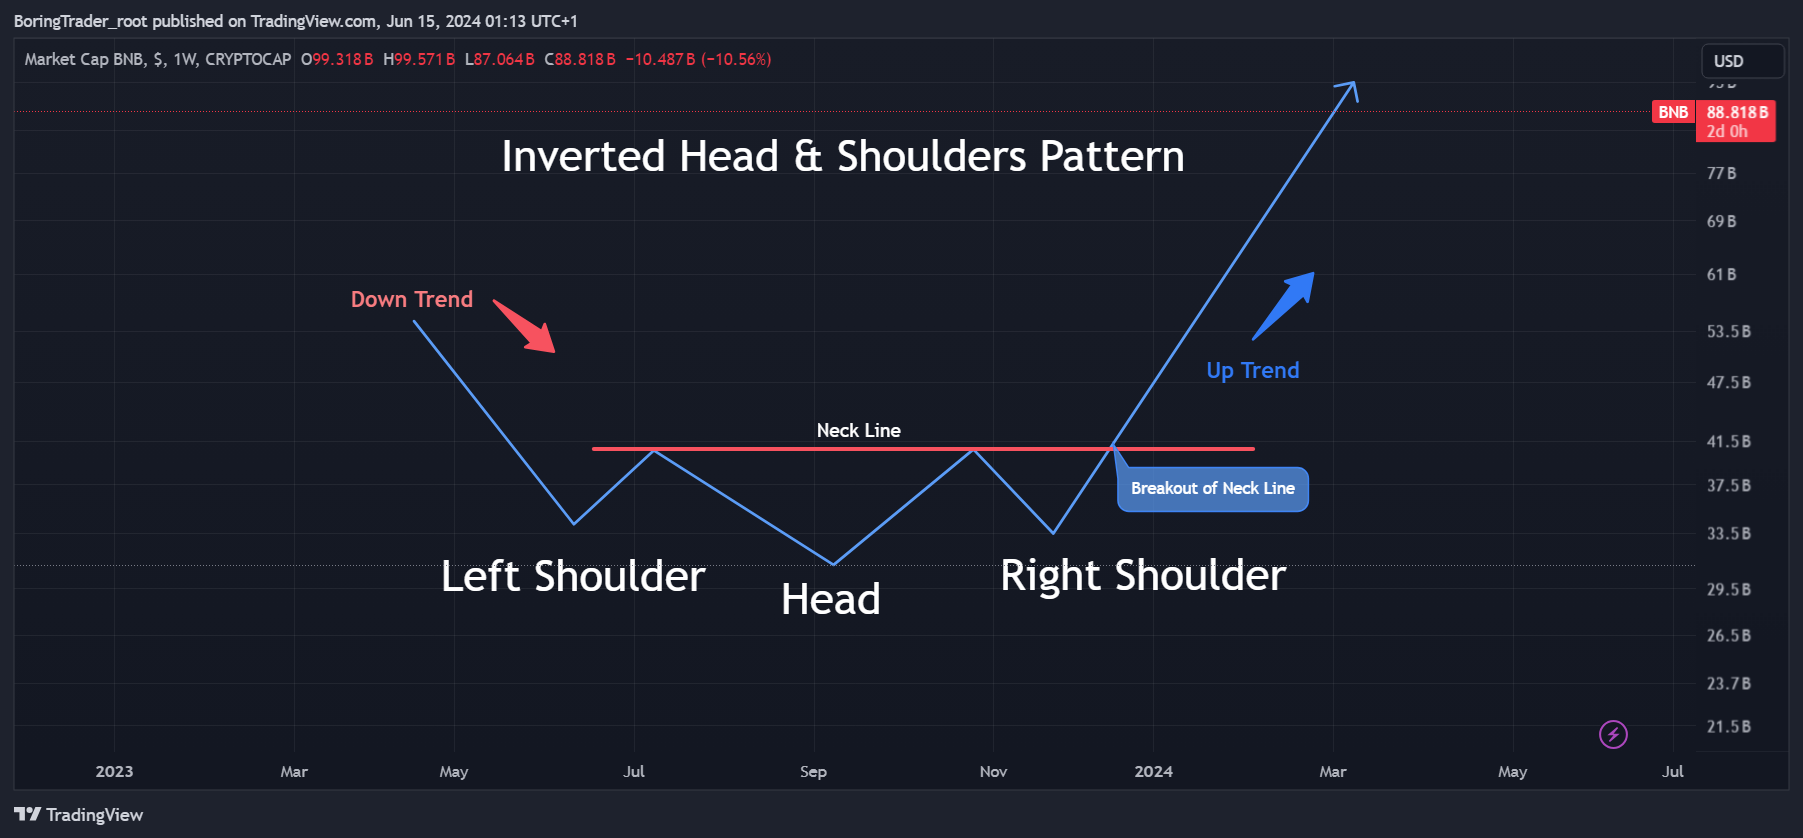
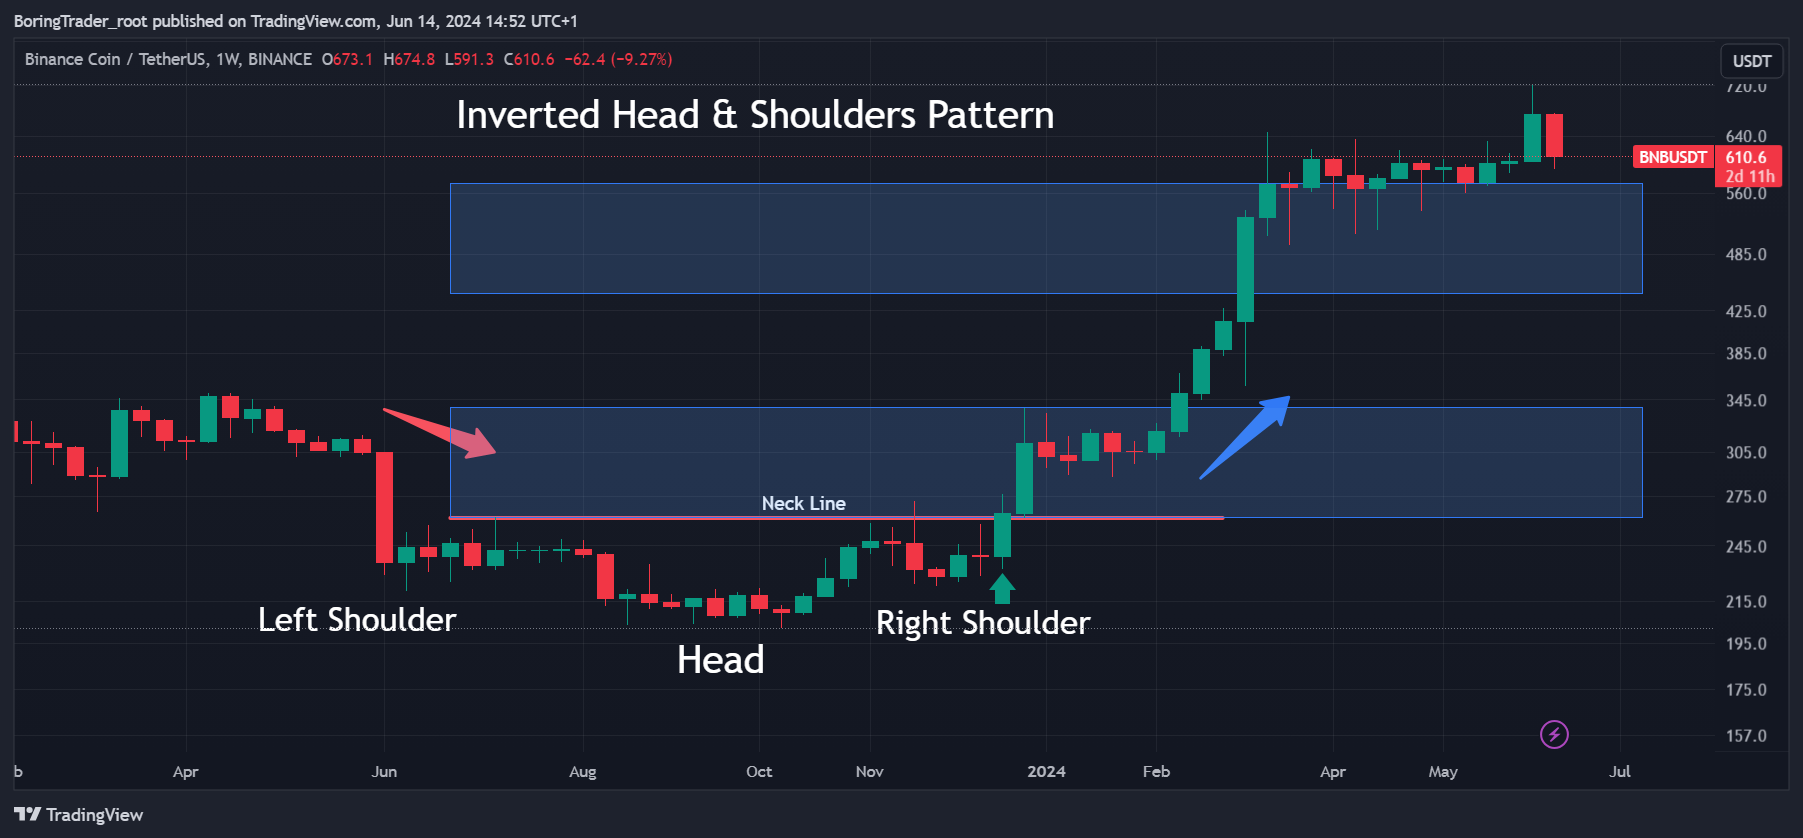
Example 1: Binance BNB Coin (BNB )
Trading the Inverse Head and Shoulders Pattern
Identifying the Pattern
- Left Shoulder: The pattern starts with a downward price movement, forming the left shoulder. In the image, the left shoulder is formed around mid-June 2023, where the price drops and then rises again, creating a low point.
- Head: Following the left shoulder, the price drops further, creating a new lower low. This forms the head of the pattern. In this chart, the head is formed around mid-October 2023, where the price reaches its lowest point.
- Right Shoulder: After the head is formed, the price rises again, then drops to create the right shoulder. The right shoulder should be similar in height to the left shoulder. In this example, the right shoulder is formed around late December 2023 to early January 2024.
- Neckline: The neckline is drawn by connecting the highs of the left shoulder and the right shoulder. It acts as a resistance level that needs to be broken for the pattern to be confirmed. In the chart, the neckline is represented by the pink horizontal line around 261 USDT.
Entry Point
A trader would enter a position when the price breaks above the neckline. This breakout confirms the pattern and indicates a potential bullish reversal. In this chart, the entry point is just above the neckline at around 261 USDT. It’s important to wait for a candle to close above the neckline to confirm the breakout, reducing the risk of a false breakout.
Take Profit Level
The take profit level is determined by measuring the distance from the head to the neckline and then projecting this distance upward from the breakout point.
- Measure the distance from the head to the neckline. In the image, the head is around 202 USDT, and the neckline is at 261 USDT, giving a distance of 59 USDT.
- Add this distance to the breakout point above the neckline. Therefore, the take profit level would be 261 USDT + 59 USDT = 320 USDT.
Stop Loss Level
A stop loss helps manage risk by limiting potential losses if the trade does not go as expected. The stop loss level is usually placed below the right shoulder to provide a safety net.
- Identify the lowest point of the right shoulder, which is around 222 USDT.
- Place the stop loss slightly below this level, for example at 210 USDT, to avoid getting stopped out by minor fluctuations.
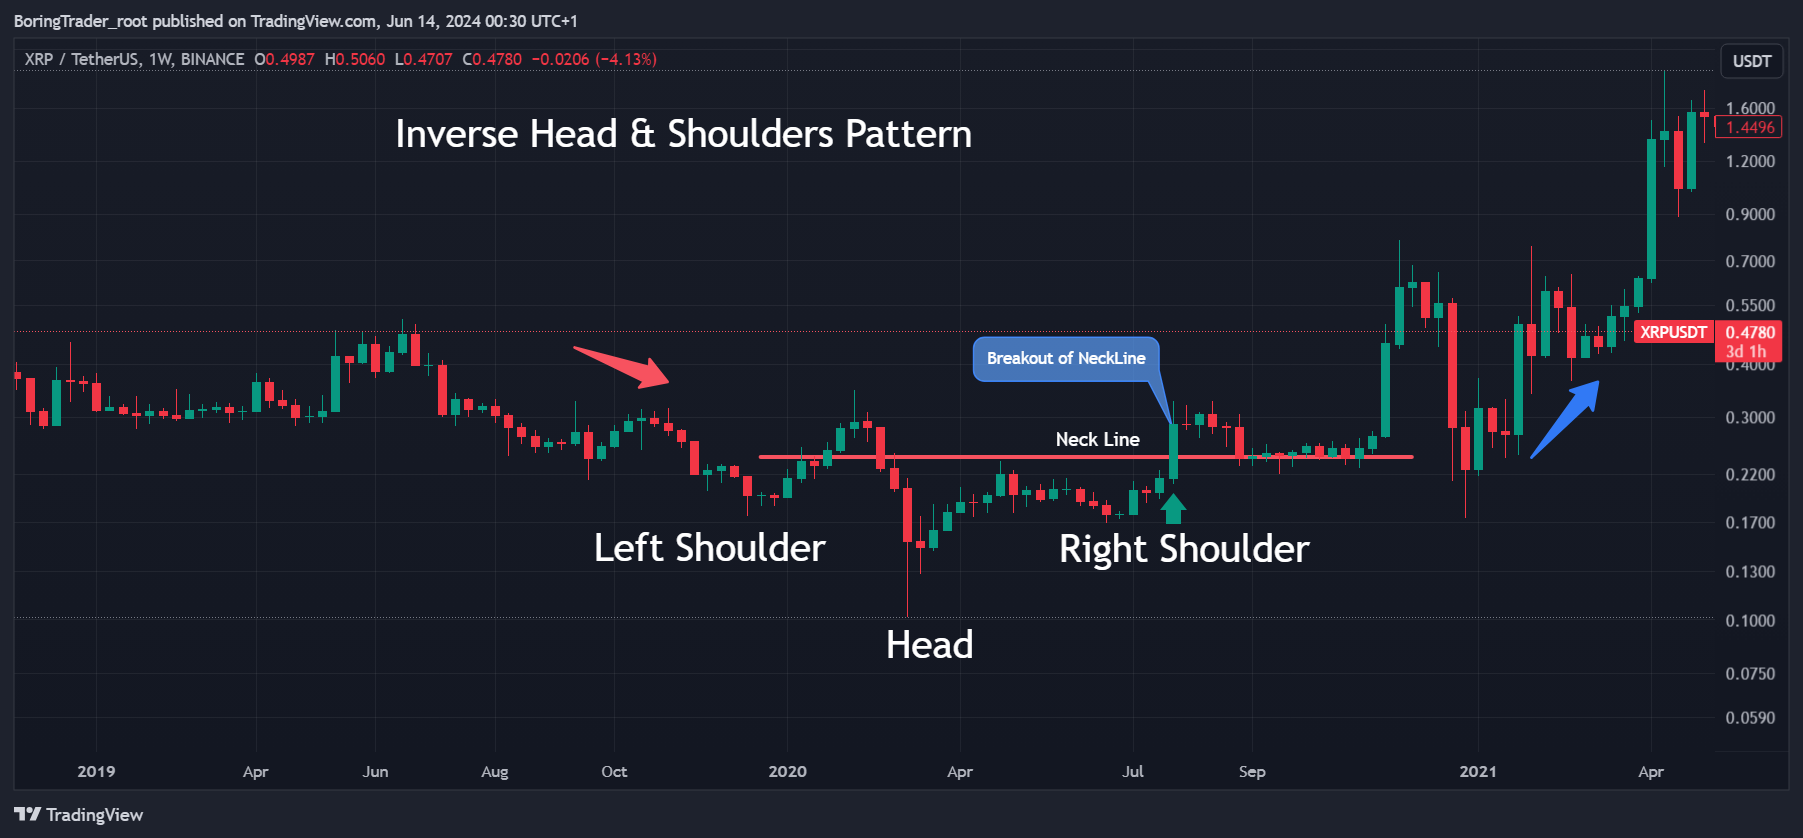
Example 2: Ripple (XRP)
Trading the Inverse Head and Shoulders Pattern on XRPUSDT
Identifying the Pattern
- Left Shoulder: The pattern begins with a downward price movement followed by a temporary rise. The left shoulder is formed around late September 2019 to early November 2019 where the price hits a low before rebounding.
- Head: After the left shoulder, the price drops further, reaching a new lower low, forming the head of the pattern. This occurs around mid-March 2020.
- Right Shoulder: Following the formation of the head, the price rises again and then drops to create the right shoulder, which should be similar in height to the left shoulder. The right shoulder forms around early June 2020 to early July 2020.
- Neckline: The neckline is drawn by connecting the highs of the left shoulder and the right shoulder. This acts as a resistance level that needs to be broken for the pattern to be confirmed. In this chart, the neckline is represented by the pink horizontal line around 0.24 USDT. However, it can also be drawn as an inclined trend line that connects the peaks that follow the left and right shoulder.
Entry Point
A trader would enter a position when the price breaks above the neckline. This breakout confirms the pattern and indicates a potential bullish reversal. In this chart of the XRPUSDT pair, the entry point is just above the neckline at around 0.24 USDT. It’s important to wait for a candle to close above the neckline to confirm the breakout, reducing the risk of a false breakout.
Take Profit Level
The take profit level is determined by measuring the distance from the head to the neckline and then projecting this distance upward from the breakout point.
- Measure the distance from the head to the neckline. In the image, the head is around 0.101 USDT, and the neckline is at 0.24 USDT, giving a distance of 0.139 USDT.
- Add this distance to the breakout point above the neckline. Therefore, the take profit level would be 0.24 USDT + 0.139 USDT = 0.379 USDT.
Stop Loss Level
A stop loss helps manage risk by limiting potential losses if the trade does not go as expected. The stop loss level is usually placed below the right shoulder to provide a safety net.
- Identify the lowest point of the right shoulder, which is around 0.101 USDT.
- Place the stop loss slightly below this level, for example at 0.090 USDT, to avoid getting stopped out by minor fluctuations.
How to Trade an Inverse Head and Shoulders Pattern
Trading the Inverse Head and Shoulders pattern involves identifying the pattern, confirming the breakout, and managing risk effectively.
- Identify the Pattern: Look for the distinct left shoulder, head, and right shoulder in a downtrend.
- Confirm the Breakout: Ensure the price breaks above the neckline with increased volume.
- Enter a Long Position: Buy when the breakout is confirmed.
- Set a Stop-Loss: Place a stop-loss order below the right shoulder to limit potential losses.
- Determine the Profit Target: Measure the distance from the head to the neckline and project it upwards from the breakout point.
FAQ
Q: What does the Inverse Head and Shoulders pattern indicate?
A: It indicates a potential reversal of a downtrend into an uptrend.
Q: Can the neckline be sloped?
A: Yes, the neckline can be horizontal or sloped.
Q: What is the importance of volume in confirming the pattern?
A: Increased volume during the breakout confirms the pattern and adds credibility to the potential reversal.
Q: Where should I place my stop-loss?
A: Place your stop-loss below the right shoulder to manage risk.
Q: How do I measure the target price for the Inverse Head and Shoulders pattern?
A: Measure the vertical distance from the lowest point of the head to the neckline. Then, add this distance to the breakout point above the neckline to determine the target price.
Q: What if the price fails to break the neckline?
A: If the price fails to break the neckline and falls back, the pattern is not confirmed. Traders should wait for a confirmed breakout before entering a trade.
Q: Can the Inverse Head and Shoulders pattern form in any time frame?
A: Yes, the Inverse Head and Shoulders pattern can form in any time frame, from intraday charts to monthly charts. However, patterns on higher time frames generally provide more reliable signals.
Q: What is the difference between a regular Head and Shoulders pattern and an Inverse Head and Shoulders pattern?
A: A regular Head and Shoulders pattern indicates a potential reversal from an uptrend to a downtrend, while an Inverse Head and Shoulders pattern indicates a potential reversal from a downtrend to an uptrend.
Q: How long does it take for an Inverse Head and Shoulders pattern to form?
A: The time it takes for an Inverse Head and Shoulders pattern to form varies and can range from a few days to several months, depending on the time frame of the chart.
Q: Should I wait for a retest of the neckline after the breakout?
A: Some traders prefer to wait for a retest of the neckline after the breakout as a confirmation before entering the trade. A successful retest followed by a bounce off the neckline can provide additional confidence in the trade.
Q: What role does the overall market trend play in the effectiveness of the Inverse Head and Shoulders pattern?
A: The overall market trend can influence the effectiveness of the Inverse Head and Shoulders pattern. Trading with the trend typically provides higher probability setups, so it’s important to consider the broader market context.
Q: Can false breakouts occur with the Inverse Head and Shoulders pattern?
A: Yes, false breakouts can occur. It’s crucial to wait for a confirmed breakout, which means waiting for a candle to close above the neckline with significant volume.
Q: Can I use other technical indicators to confirm the Inverse Head and Shoulders pattern?
A: Yes, using other technical indicators such as moving averages, RSI, and MACD can provide additional confirmation for the pattern and help validate the trade setup.
Q: What should I do if the pattern fails?
A: If the pattern fails and the price moves back below the neckline, it’s important to exit the trade to minimize losses. The stop-loss should help manage risk in such scenarios.
Q: Are there any common mistakes traders make when trading the Inverse Head and Shoulders pattern?
A: Common mistakes include entering the trade before the pattern is confirmed, ignoring the volume aspect, and not placing a proper stop-loss. Patience and discipline are key to successfully trading this pattern.