Rarely does the market follow a straight path; even during trends, prices zigzag, generating swing lows and highs. This is common for most assets. As a result, inside bullish trends, investors frequently encounter brief negative corrections, which give rise to patterns like the wedge, triangle, flag, or channel.
These indicate that profit-taking is lowering purchasing pressure.
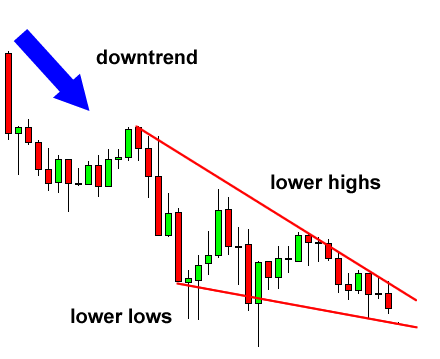
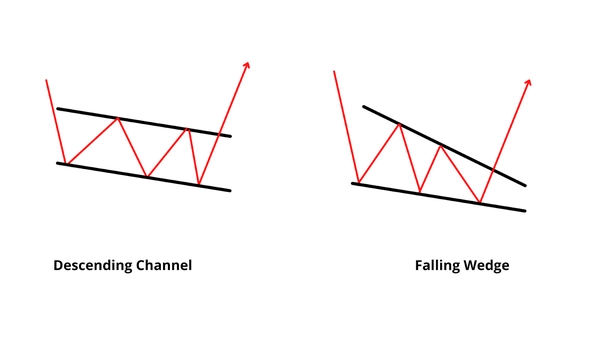
A chart pattern known as a falling wedge is created by drawing two descending trend lines, one for the highs and one for the lows.
The highs are declining more quickly than the lows, as indicated by the trend line representing the highs having a lower slope than the lows.
A successful falling wedge pattern requires a minimum of five reversals, with two required for one trend line and three for the other.
This pattern gets its name from the final shape, which eventually narrows into a wedge.
It is important to interpret the falling wedge as an excellent buy signal that the trend will change.
Falling Wedge Pattern Examples
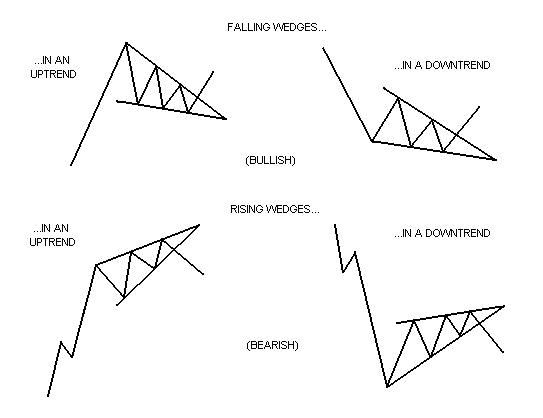
The two examples of the falling wedge pattern are given below:
The uptrend’s falling wedge shows that the trend is still going strong. This example is formed when prices are making lower highs and lower lows in relation to earlier price moves. It allows traders to average their position in the market or acquire purchase positions.
An uptrend reversal is indicated by the falling wedge in a downward trend. It is formed when prices are making lower highs and lower lows in relation to earlier price moves. It provides trading possibilities for buyers to enter the market.

Is the Falling Wedge Pattern Bullish?
Even if a falling wedge pattern follows a bearish trend, it is still bullish. It means that bears have momentarily gained control of the price and that bulls have lost steam. The price then begins to descend to new lows, albeit at a corrective rate.
How to Trade the Falling Wedge Pattern
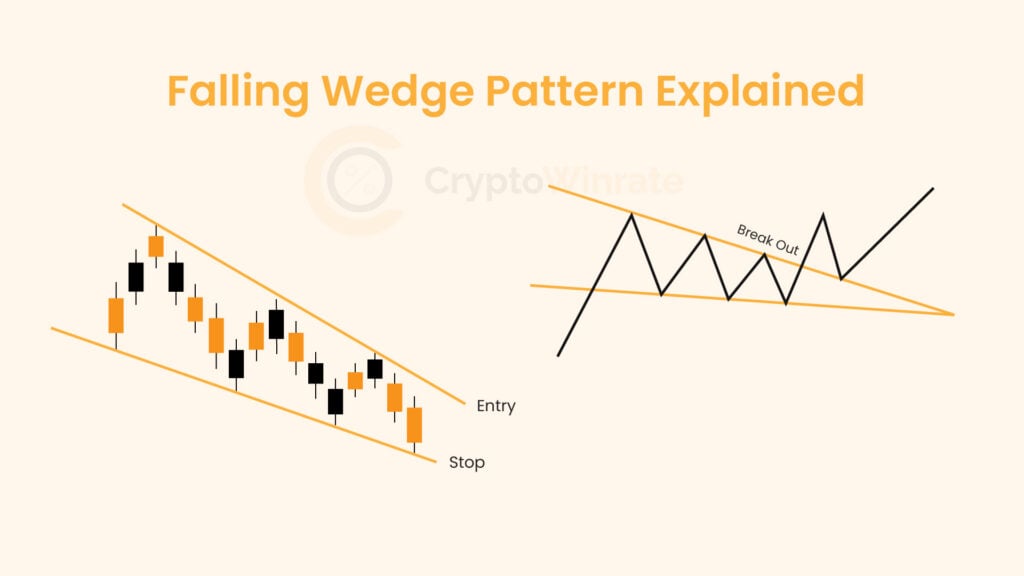
Six main phases are involved in leveraging the falling wedge pattern in trading. Finding the wedge pattern on a chart is the first step. Second, keep an eye on the breakout. Verifying the breakout occurs in the third stage. Entering the trade is the fourth step. The last stage is establishing a stop-loss order and, ultimately, a profit plan.
- Locate and recognize the falling wedge pattern on a graph. Draw trend lines parallel to the swing highs and lows to highlight the pattern.
- Pay attention to a potential breakout. This suggests that the price moves outside of the established wedge pattern.
- Examine the breakout. Verify whether the price has moved out of the wedge. Make sure you have drawn the trendlines to suit your tastes; typically, they are drawn connecting swing highs and lows.
- Go into the market. Open a buy position if the price crosses the falling wedge pattern’s top trendline.
- It is important to put in a stop-loss order. Some traders decide to place their stop-loss order slightly outside the breakout side of the pattern. Some people position the stop-loss closer to keep the stop-loss magnitude smaller. Managing risk is an essential aspect of trading.
- Establish your profit objective and decide how to close a deal when it is profitable. The peak of the wedge at its thickest point, added to the breakout or entrance, represents an expected profit target.

Pros and Cons of the Rising Wedge Pattern
Pros
The opportunity to enter even after missing an initial move, price objective, beneficial risk-reward ratios, increased frequency of occurrence, distinct stop, entry, and limit levels, and enhanced accuracy are the main advantages of a falling wedge pattern in technical analysis.
- The falling wedge pattern occurs regularly in financial markets, including stocks, commodities, forex, and cryptocurrency.
- There are distinct limit, entry, and stop levels in the pattern. The trading technique allows traders to set stop-loss orders at predefined levels to limit potential losses. Trader stop-loss orders are often placed below the collapsing wedge pattern’s support line.
- It offers a positive ratio of risk to profit. When a trade has a positive risk-reward ratio, the potential profit outweighs the potential risk.
- Leveraging the falling wedge pattern. Traders enter a trending market after missing the initial gain (continuation instance).
- Traders use a falling wedge pattern to establish a price target for long positions. Usually, a vertical expansion from the breakout position to the pattern’s peak at its widest point establishes the price goal.
One of the key components that traders need to make good trades is a suitable risk-reward ratio, which the falling wedge pattern is renowned for offering. Providing traders with defined stop, entry, and limit levels also aids in risk management and maximizes profit possibilities.
Cons
Technical analysts consider a falling wedge pattern to have five main drawbacks: it is confusing, necessitates further confirmation, gives misleading signals, is frequently interpreted erroneously, and places an inappropriate stop-loss.
- It is a confusing pattern for novice traders. Traders must determine if the convergent trendlines indeed show a collapsing wedge or if they are just part of a longer period of consolidation.
- Confirming the descending wedge pattern with oscillators and additional technical indicators is necessary.
- It frequently sends out erroneous signals. When a pattern anticipates a particular result, such as a bullish reversal, but the market moves against expectations, this is known as a false signal.
- The falling wedge shows a continuation or reversal pattern – correct identification is key.
Conclusion
The falling wedge pattern, which might indicate a continuation or reversal pattern, often gives erroneous signals. Therefore, it is crucial to recognize the pattern correctly. The falling wedge pattern is a helpful tool for seasoned traders, but novices should exercise caution while utilizing it.
References


