
Descending triangles are significant chart patterns used by traders to anticipate potential downtrends in the market. These patterns offer insights into market sentiment and help identify areas of potential price breakdowns. By understanding the characteristics and signals of descending triangles, traders can effectively capitalize on bearish trading opportunities.
In this guide, we’ll look into the details and trading strategies associated with descending triangles, providing you with the knowledge and confidence needed to handle this pattern successfully. Join us as we explore more descending triangles and unlock their trading potential. Let’s get started.
What is a Descending Triangle?
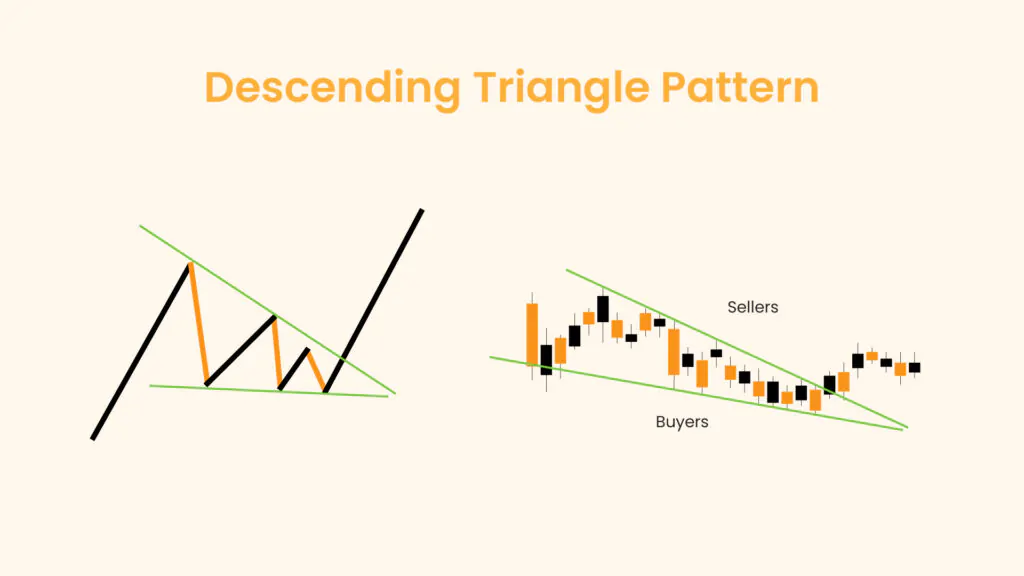
A descending triangle pattern in trading is a bearish technical analysis formation that typically indicates a potential downward breakout. It is characterized by a series of lower highs converging towards a horizontal support level. The pattern forms as selling pressure increases, creating lower peaks, while the horizontal support is tested multiple times, indicating buyer interest at that level.
Traders watch for a break below the support line, as this signals a likely continuation of the downtrend. Volume often decreases during the formation of the triangle and then increases sharply on the breakout. This pattern is commonly used to identify potential short-selling opportunities or to time exits from long positions. Properly recognizing and trading the descending triangle can help traders manage risk and capitalize on anticipated market movements.
Key Notes
- A Descending Triangle is a bearish continuation pattern.
- Descending Triangles have a horizontal support line and a downwards-sloping resistance line.
- Descending Triangles are best for shorting the market and speculating for lower prices.
- The best trade entries for Descending Triangles are touches at the upper resistance line or the breakout below the horizontal support line.
Descending Triangle Examples
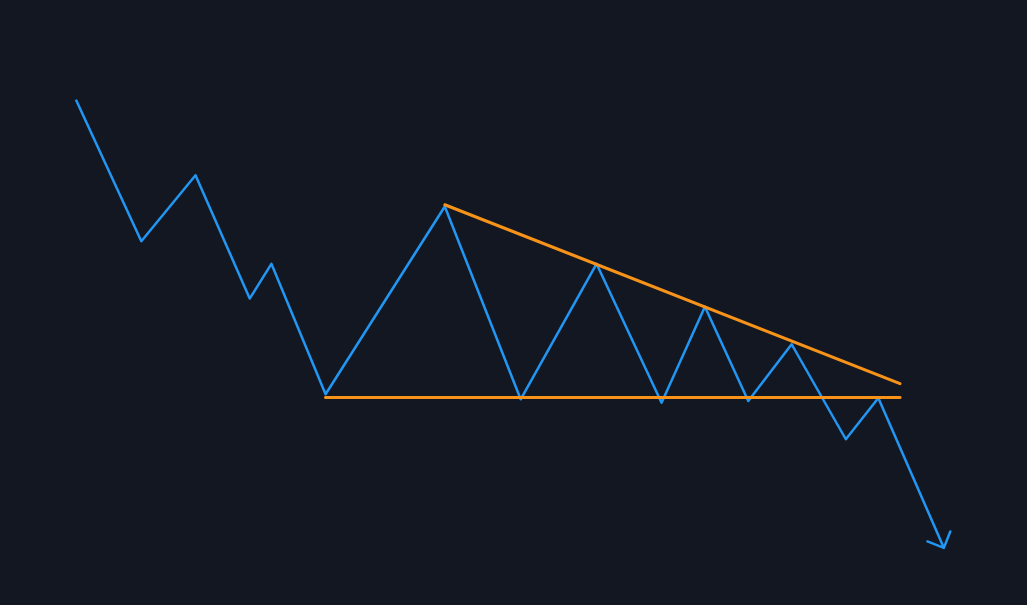
Here is an example of how a descending triangle might manifest in trading. In the image below, we observe a descending triangle pattern forming within the market.
The descending triangle pattern typically arises within a prevailing downtrend, signaling a phase of unification characterized by price fluctuations between a downward-sloping upper trendline and a horizontal support level. Traders keenly monitor this setup, anticipating a potential breakout below the support line. Entry orders are strategically placed above the descending upper trendline and below the support level, allowing traders to capitalize on breakout movements in either direction.
Confirmation of the breakout is crucial, often accompanied by increased volume, validating the strength of the price movement. Profit targets are set based on the height of the triangle pattern, while risk management techniques, such as stop-loss orders, are employed to mitigate potential losses. As traders handle this descending triangle pattern, careful analysis and disciplined execution are essential for successful trading outcomes.
How to Trade the Descending Triangle
Trading a descending triangle involves a strategic approach to capitalize on potential price movements within the pattern. Here’s how to trade a descending triangle pattern:
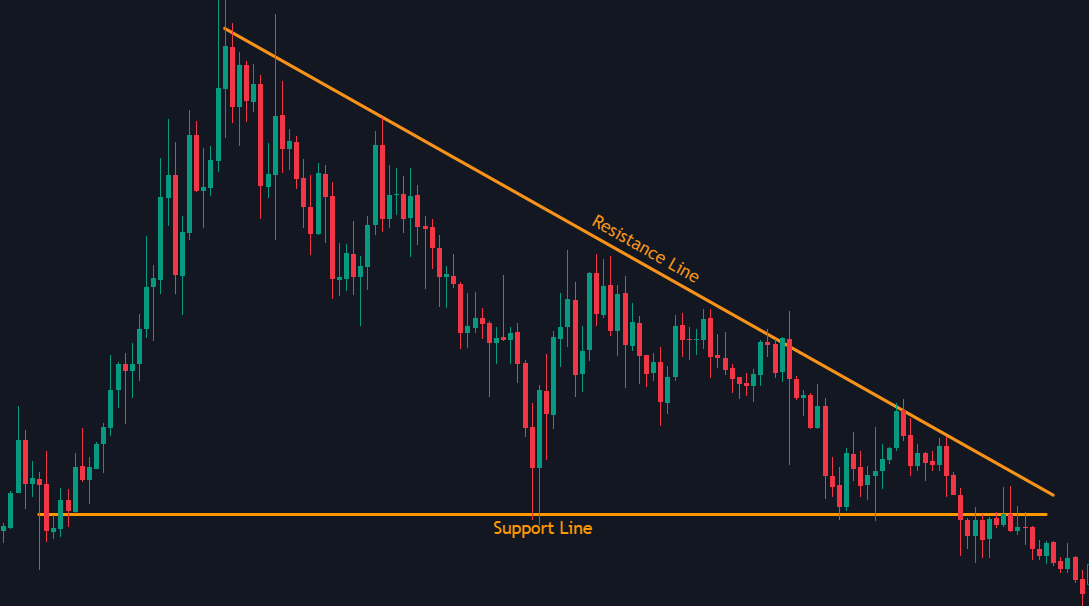
1. Identification: Begin by identifying a downtrend in the market, followed by a consolidation phase where lower highs and a horizontal support level become apparent. This forms the essential structure of a descending triangle pattern.
2. Entry Points: Once the descending triangle pattern is identified, consider placing entry orders strategically. Position short entry orders above the upper trendline (lower highs) and below the support line to capture potential breakout movements in either direction.
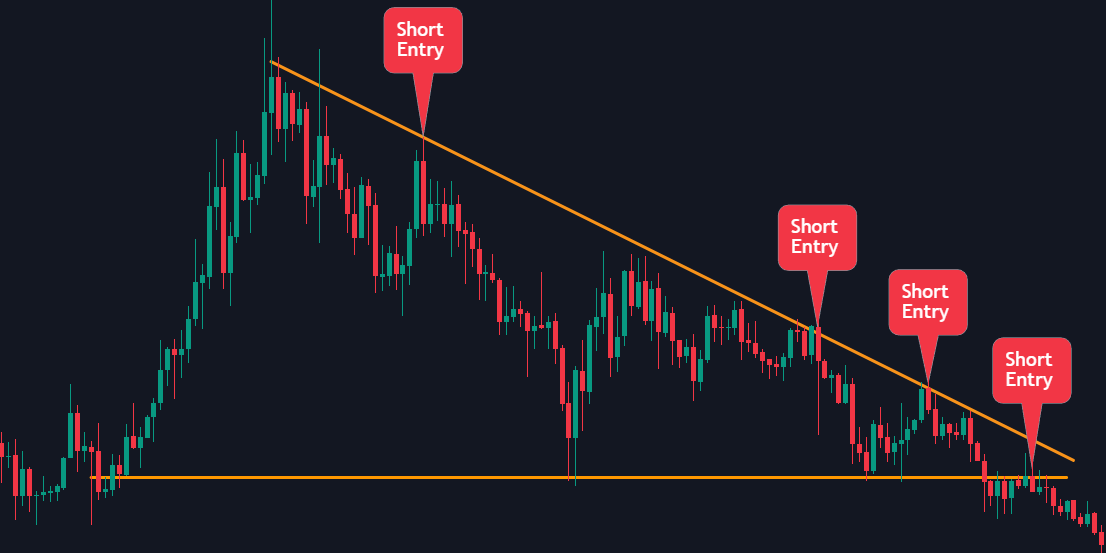
3. Confirmation of Breakout: Monitor the price action closely for a breakout confirmation. While most often, the price breaks below the support line, signaling a continuation of the downtrend, remain vigilant for instances where the support proves resilient, leading to a breakout above the upper trendline. In the screenshot above, you can see the breakout at the very last “Short Entry” callout. After going below the support line, the price fails to break back into the descending triangle pattern. Instead, it gets rejected, and the previous support turns into resistance. This is a typical breakout confirmation.
4. Trade Execution: Upon breakout confirmation, execute trades in the direction of the breakout. For a downside breakout, consider entering short positions to capitalize on the anticipated continuation of the downtrend. Conversely, for an upside breakout, initiate long positions to benefit from the potential reversal or bullish continuation.
5. Setting Targets and Stop Losses: Determine appropriate target levels and stop-loss orders to manage risk and optimize profit potential. Target levels can be set based on the height of the triangle pattern, while stop-loss orders should be placed to limit potential losses in case of adverse price movements.
6. Monitoring and Adjustment: Continuously monitor the trade progress and adjust positions as necessary based on changing market conditions. Consider trailing stop-loss orders to secure profits and mitigate risks as the price continues to move in the direction of the breakout.
By following these steps and maintaining a disciplined approach to trading, traders can effectively capitalize on the opportunities presented by descending triangle patterns in financial markets.
Note: While trading descending triangle patterns can be lucrative, it’s essential to approach them with caution. No trading strategy is foolproof, and patterns may not always unfold as expected. It’s crucial to conduct a thorough analysis, consider additional indicators, and practice risk management to handle the complexity of the market effectively.
Pros & Cons of the Descending Triangle Pattern
Descending Triangle Pros
- The descending triangle pattern provides clear levels for traders to monitor, with well-defined support and resistance lines, making it easier to plan trades.
- This pattern often indicates a continuation of the current downtrend, allowing traders to position themselves for potential future price movements.
- Traders can use the descending triangle to identify strategic entry points, taking advantage of the breakout below the support line.
- The support and resistance lines provide natural levels for setting stop losses, helping to manage risk more effectively.
- The height of the triangle can be used to estimate potential price targets, aiding in setting realistic take-profit levels.
- The descending triangle can be used in conjunction with other technical indicators, like volume and RSI, to confirm breakouts and increase the reliability of trade decisions.
Descending Triangle Cons
- One of the biggest weaknesses is the risk of false breakouts, where the price temporarily breaks below the support line but then reverses back inside the triangle.
- Traders might misinterpret the pattern if the trendlines are not drawn accurately, leading to incorrect trading decisions.
- The effectiveness of the descending triangle can be influenced by broader market conditions, which might override the pattern’s signals.
- To reduce the likelihood of failed breakouts, it is often necessary to confirm signals with additional technical indicators, adding complexity to the trading strategy.
Descending vs Ascending Triangle Difference
The key difference between ascending and descending triangle chart patterns lies in their structural features and directional signals.
A descending triangle appears during downtrends and is a bearish continuation pattern. It features a horizontal lower trendline that acts as support and a descending upper trendline that serves as resistance. This formation indicates increasing selling pressure, as sellers push the price lower, which may lead to a breakdown below the support level.
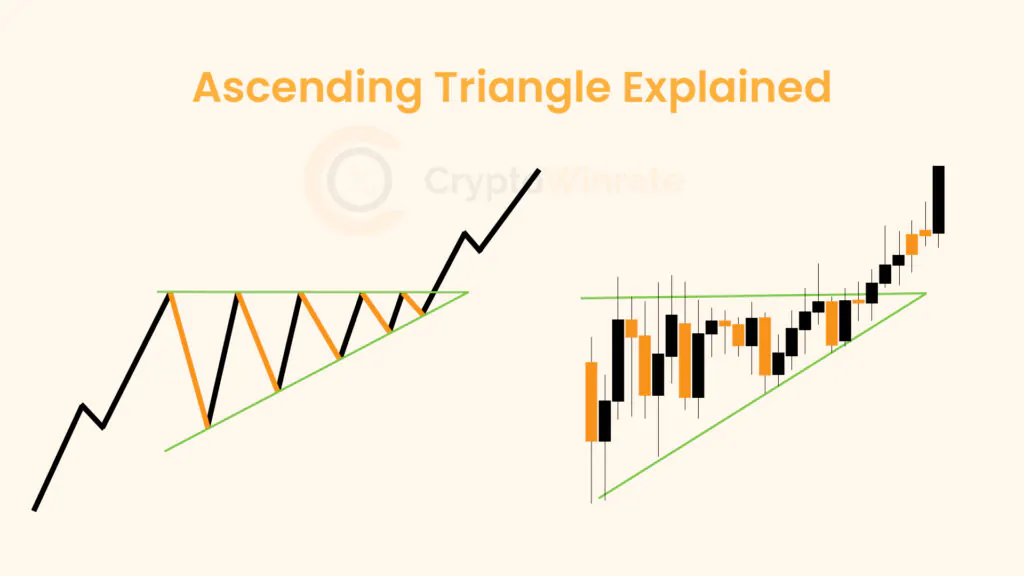
On the contrary, an ascending triangle typically forms during uptrends and is a bullish continuation pattern. It is characterized by a horizontal upper trendline that acts as resistance and a rising lower trendline that serves as support. This setup suggests growing buying pressure, as buyers push the price higher, eventually leading to a potential breakout above the resistance.
In summary, ascending triangles indicate bullish continuation, while descending triangles indicate bearish continuation, each reflecting their respective trend directions and formations.
In a Nutshell
Becoming proficient in identifying and trading the descending triangle pattern can greatly benefit traders looking to take advantage of bearish market movements. By understanding its formation, recognizing critical support and resistance levels, and implementing sound entry and exit strategies, traders can utilize the power of this pattern to make informed trading decisions and potentially increase their profitability in the always-shifting financial markets.
FAQs
1. How do traders confirm a descending triangle’s validity versus a false breakout?
Traders validate a descending triangle by observing sustained price movement beyond its boundaries, confirmed by significant volume and follow-through in the breakout direction. A retest of the previous support or resistance level is also a great confirmation signal.
2. What risk management strategies benefit traders in handling descending triangle patterns?
Traders employ stop-loss orders beneath support for shorts and above resistance for longs. Additionally, they use position sizing to mitigate risks effectively.
3. Are there specific time frames or market conditions favoring reliable descending triangle patterns?
While descending triangles appear in various time frames and market conditions, they tend to be more reliable when preceded by a clear downtrend and observed in higher time frames for increased accuracy.