
Perpetual DEXs (Perp DEXs) have given crypto trading a whole new dimension. With new platforms emerging rapidly, each one aims to stand out by offering unique advantages. Hyperliquid sets itself apart in many ways, and one of its standout features is the Hyperliquid Stats page; a powerful tool that provides traders with valuable insights into the platform’s performance. By enabling users to monitor key metrics, this feature builds trust between traders and the platform. In this guide, we will take a closer look at the Hyperliquid Stats page, its importance, and the key metrics it displays.
Hyperliquid (HYPE)
New TokenToken Symbol
HYPE
Current Price
Loading...
Daily Change
Loading...
All-Time High
Loading...
Daily Low
Loading...
Daily High
Loading...
24h Volume
Loading...
Market Cap
Loading...
FDV
Loading...
Total Supply
Loading...
Max Supply
Loading...
Why the Hyperliquid Stats Page Matters
If you’re new to trading, you might overlook the significance of the Hyperliquid Stats page. However, when engaging with decentralized trading platforms, trust is arguably the most critical factor for any exchange’s success. Traders often hesitate to use platforms that lack transparency and fail to provide insights into their performance or user activity.
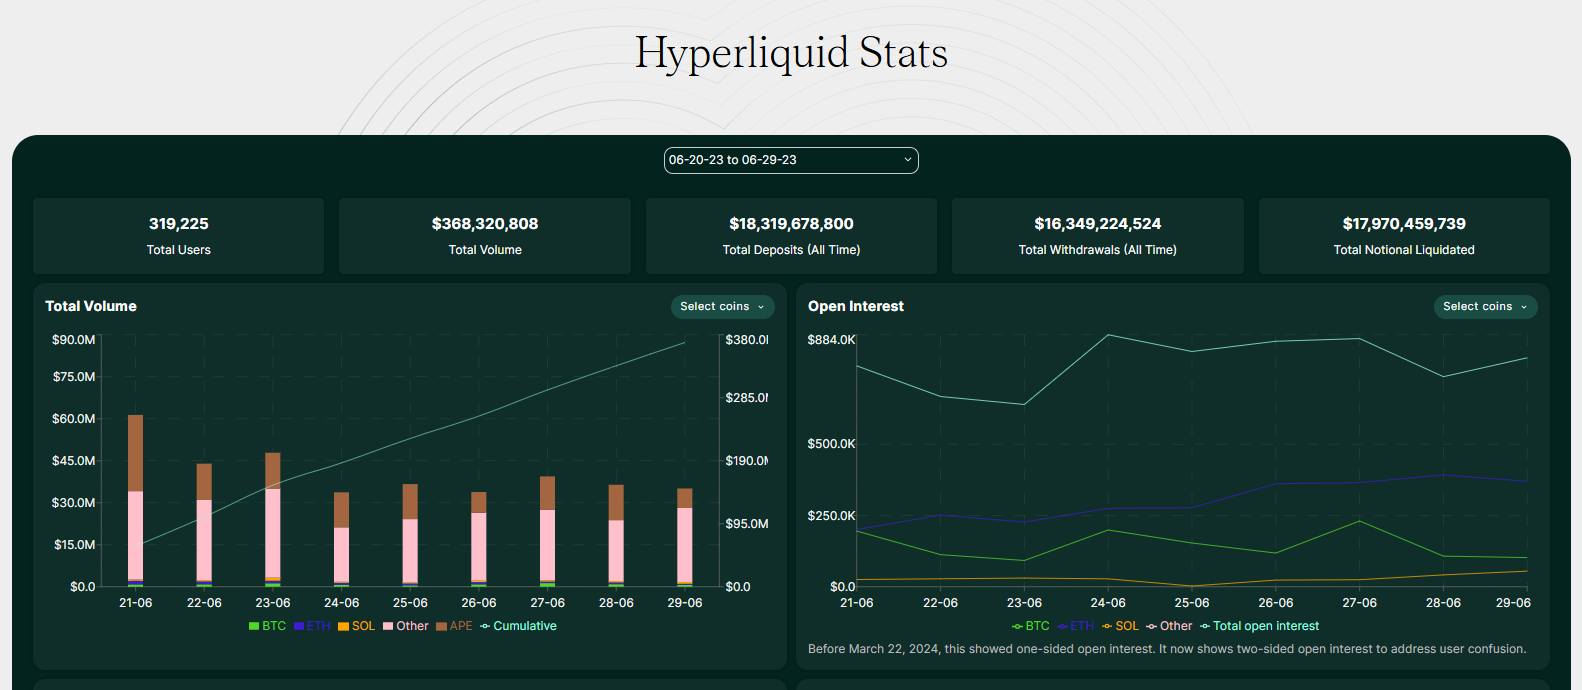
Hyperliquid addresses this concern through its stats page, which offers a clear and transparent view of key metrics such as trading volume, user growth, and profit-and-loss data. This openness allows traders to evaluate the platform’s health and reliability, building trust and confidence within the ecosystem.
Beyond transparency and trust, data serves as a critical asset for traders aiming to make informed decisions. The Hyperliquid Stats page goes beyond simply sharing information—it provides daily insights into crucial platform metrics like open interest, liquidation trends, and funding rates. These live metrics help traders refine their strategies, adapt to market conditions, and gain a clearer picture of ongoing trends.
Features of the Hyperliquid Stats
Before diving into how the platform can be a great source of insights for traders, let’s take a closer look at some of its key features. These tools ensure you can make the most of the Hyperliquid Stats page and access the information that matters most to you.
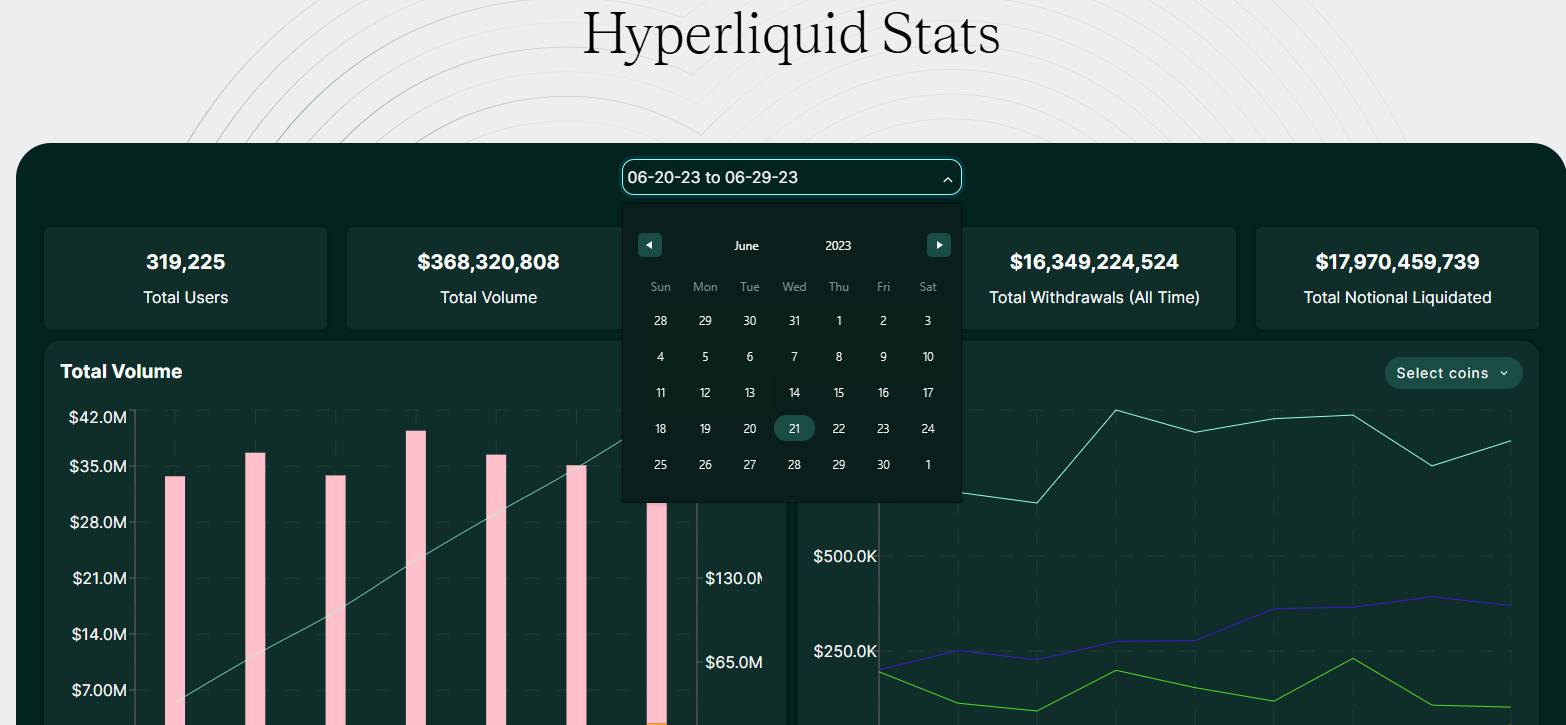
1. Calendar
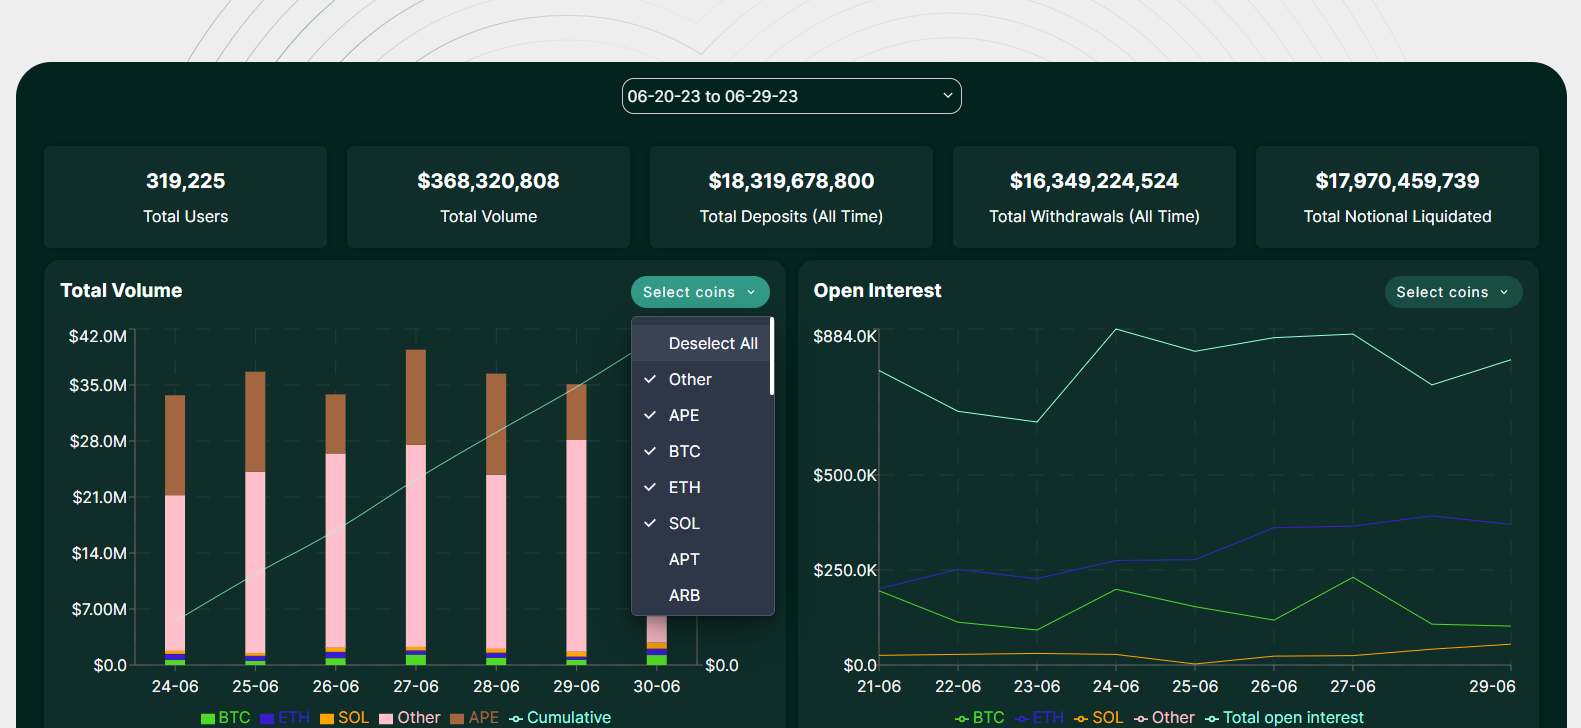
By default, Hyperliquid displays data for a 2-week span. However, using the calendar tool, you can customize the time frame to suit your needs. Whether you want to analyze data over a month or focus on a specific date, this feature lets you explore metrics for the periods you’re most interested in.
2. Asset List
Most charts on the stats page come equipped with an asset dropdown menu, allowing users to filter data by specific cryptocurrencies, such as BTC, ETH, or SOL. This makes it easy to focus on trading volume, Open Interest, and other metrics for individual assets, enabling a more targeted analysis.
3. Interactive Charts
The charts on the Hyperliquid Stats page are interactive. Hovering over them reveals precise data points for specific times or conditions, making it easier to track trends and extract actionable insights without needing to download or process raw data.
4. Filters
Charts also come with built-in filters, giving users control over the data displayed. These filters let you toggle between metrics, assets, or time periods, ensuring the information presented is relevant and easy to interpret.
Key Metrics Explained
There are several key metrics available on the platform, with multiple filters to make the data easier to understand. However, the most important ones are the following:
Total Trading Volume
“Total Trading Volume” measures the total value of all trades executed on the platform within a specific period. This metric is crucial because high trading volume is indicative of a liquid market.
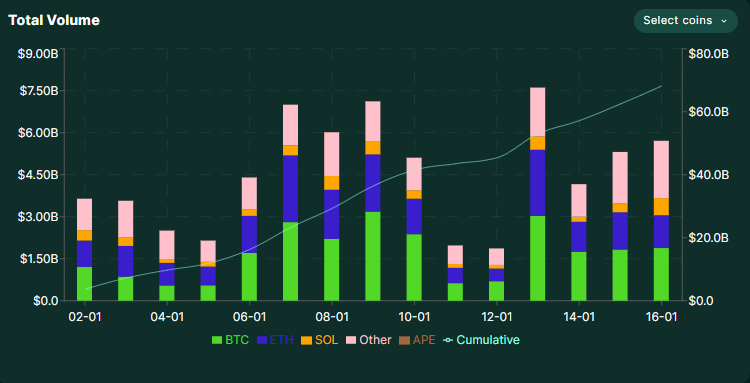
A liquid market allows for quicker trade executions and minimizes slippage, making it easier for traders to enter or exit positions without significant price deviations. For new traders, monitoring this metric helps in understanding the overall market activity and how much capital is being circulated on the platform.
Liquidations
The “Liquidations” metric tracks the total notional value of positions that have been forcefully closed due to insufficient margin. It provides a clear picture of market volatility and risk exposure on the platform.
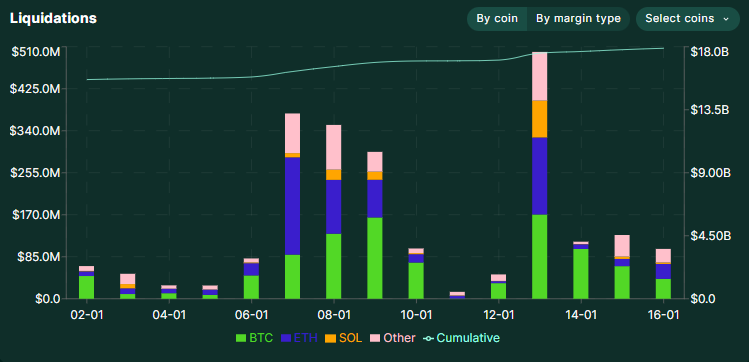
High liquidation values often indicate rapid price movements, helping traders identify periods of increased risk. By keeping an eye on liquidation trends, traders can better prepare for potential market swings and adjust their strategies accordingly.
Annualized Funding Rates
Funding rates reflect the cost of holding long or short positions on the platform and are periodically paid between traders.
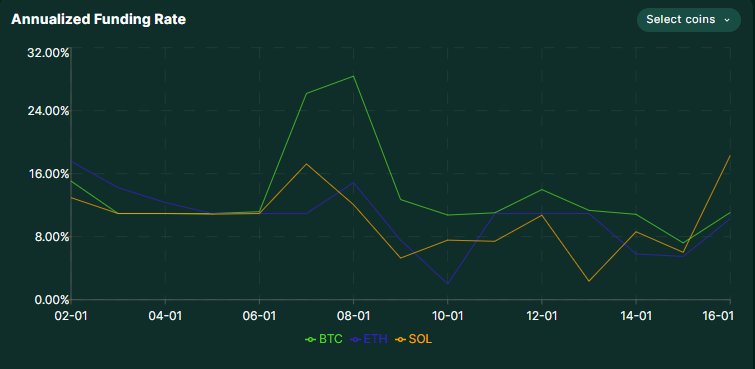
These rates are crucial for understanding market sentiment—positive rates may indicate a bullish sentiment, while negative rates suggest bearish behavior. Monitoring funding rates helps traders decide whether to enter or exit positions based on potential costs.
Slippage
“Slippage” measures the percentage difference between the expected price of a trade and the actual price at execution.
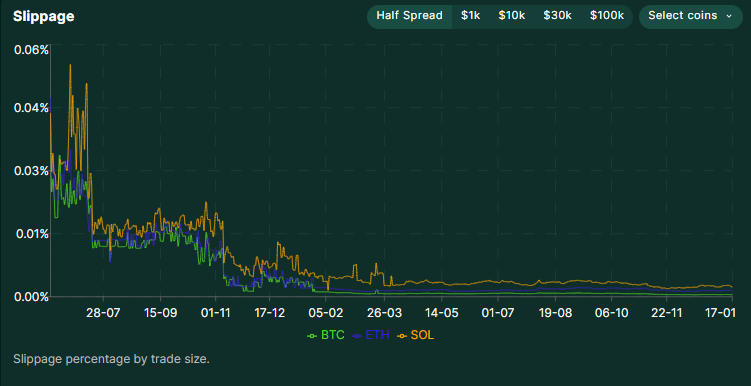
This metric helps traders assess how efficiently they can execute trades without experiencing unexpected costs. Higher slippage indicates lower liquidity or larger trade sizes, making it a critical factor to consider for effective trading strategies.
Open Interest
“Open Interest” represents the total number of outstanding contracts on the platform that haven’t been settled. It’s an important indicator of market activity and can help gauge trader sentiment.
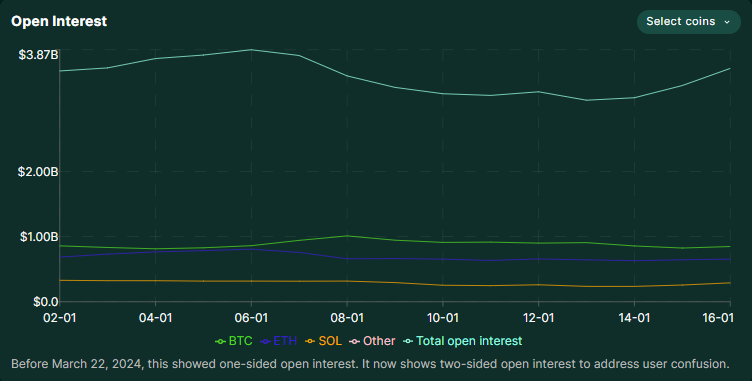
For instance, increasing open interest often signals a growing interest in the market, while a decline may indicate less active trading or a shift in market conditions. Traders can use this data to anticipate potential price movements and adjust their strategies accordingly.
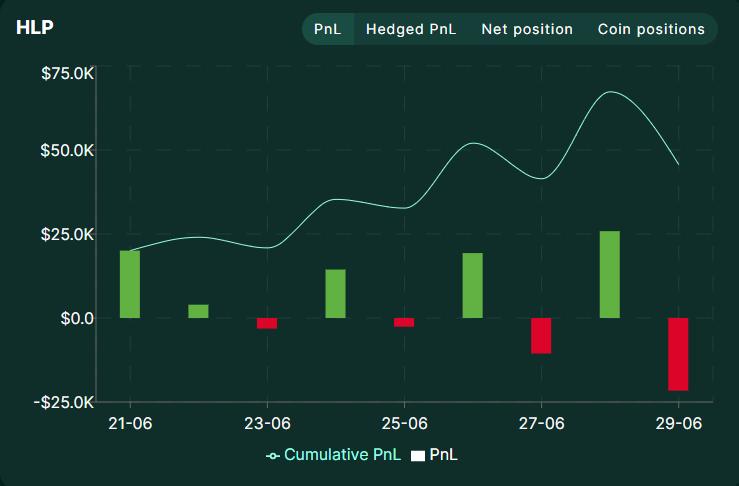
Traders Net PnL
The “Profit and Loss” (PnL) metric tracks the cumulative profit or loss for traders on the platform over time. This information is helpful for assessing the platform’s overall trading performance.
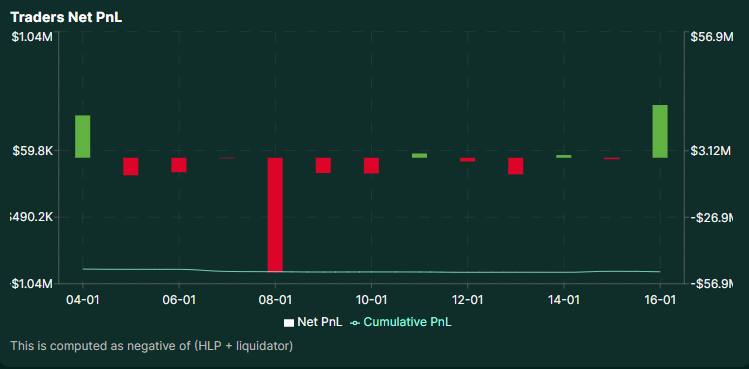
For individual traders, PnL data offers insights into their historical performance and helps refine trading strategies. Monitoring these numbers regularly can help identify successful trading patterns or areas where strategies may need to be adjusted.
Why These Metrics Matter for Trading Decisions
The Hyperliquid Stats page isn’t just a collection of numbers—it’s a decision-making powerhouse. By providing up-to-date data, it enables traders to analyze market activity, liquidity, and overall platform health. Metrics like Open Interest, PnL, and Total Volume offer critical insights into market trends, helping traders navigate the complexities of perpetual DEXs with greater confidence. Understanding these metrics isn’t optional; gaining a better grasp of how to read and analyze them can serve as a de-risking strategy while trading.
Using Metrics to Inform Trading Strategies
Hyperliquid’s stats provide actionable insights to fine-tune trading strategies:
- Funding Rates reveal the cost of holding positions, guiding traders on when to open or close them.
- Daily Unique Traders highlight market participation, helping assess trade timing and volume.
- Slippage Data helps traders optimize trade sizes, avoiding unnecessary losses from price impacts.
Building Confidence as a New Trader
For newcomers, trading on a decentralized platform can feel intimidating. The Hyperliquid Stats page simplifies this journey by offering transparent and actionable insights. Metrics like Deposits vs. Withdrawals and Total Users demonstrate the platform’s trustworthiness and adoption. New traders can observe trends, experiment with small positions, and build their confidence over time. With access to clear, reliable data, even beginners can make informed decisions and grow into confident, skilled traders.
Tips for Interpreting the Data
To get the most out of the Hyperliquid Stats page, traders should focus on the following strategies:
1. Start with Key Metrics
Begin by analyzing fundamental metrics like Total Trading Volume, Open Interest, and Profit and Loss (PnL). These provide a snapshot of market activity, liquidity, and overall trading performance. For new traders, these are the best starting points to understand platform dynamics.
2. Look for Trends Over Time
Metrics like Daily Unique Traders and Funding Rates are most useful when viewed as part of a trend. Are user numbers increasing, signaling growing trust in the platform? Are funding rates becoming more favorable for specific positions? Identifying trends helps traders make predictions and adapt their strategies.
3. Combine Metrics for Deeper Insights
Metrics work best when analyzed together. For example, comparing Open Interest with Liquidations can highlight high-risk periods, while pairing Trading Volume with PnL trends can indicate market sentiment. By combining data points, traders can uncover nuanced patterns and make well-informed decisions.
Explore the Stats Page for Updates
The Hyperliquid Stats page isn’t static—it’s a dynamic hub of data designed to keep traders informed about every market shift. From tracking live trading volumes to monitoring instantaneous changes in Open Interest and Funding Rates, the page empowers users with up-to-the-minute insights.
By regularly checking the stats, traders can stay ahead of sudden market movements, fine-tune their strategies, and make timely decisions. Although the updates aren’t in real time, the structured daily data provides consistent and reliable insights, ensuring traders are equipped with up-to-date information.
FAQs
1. Can I track specific cryptocurrencies like BTC or ETH on the stats page?
Yes, the stats page categorizes metrics by cryptocurrencies, such as BTC, ETH, and SOL. This allows traders to analyze specific coin performance, including trading volume, Open Interest, and liquidation trends, to tailor their strategies accordingly.
2. How can I use the stats page to minimize slippage in trades?
By monitoring slippage data for different trade sizes, traders can optimize the size of their trades to reduce the impact of price movements. This ensures better execution and lower unexpected costs during trading.
3. Does the stats page help identify risk during volatile markets?
Yes, metrics like Liquidations and Net PnL trends provide a snapshot of market volatility and risk. Tracking these metrics during turbulent times can help traders manage exposure and adjust their strategies to mitigate losses.
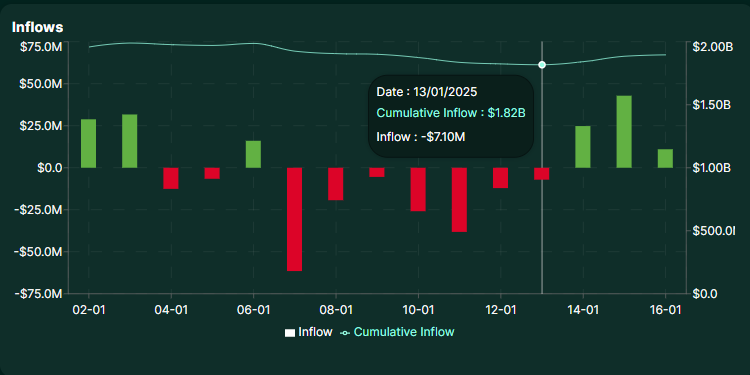
4. How do cumulative metrics like Total Deposits or Total Withdrawals provide insights?
Cumulative metrics reflect the overall trust and sentiment towards the platform. For example, higher deposits than withdrawals signify user confidence, while a spike in withdrawals might indicate caution or market shifts.
5. Are there any tools or filters on the stats page to simplify data analysis?
The stats page offers multiple filters to make data more accessible, such as categorizing by time frames or asset types. This helps traders focus on the specific insights they need without being overwhelmed by excess information.